Build your first forecast without starting from a blank spreadsheet
Revenue, costs, expenses, personnel, investment and cash linked across five years. Yellow controls are centralized on Inputs. Mode 1 uses four revenue streams and five roles; mode 2 uses the original aggregate amounts. The two modes are not added together. The written three-stream example is retained as historical material; the table contains four and each can be disabled. All data are fictional.
One-time payment
$29
Hosted checkout by Recurrente · immediate on-site fulfillment after payment confirmation · 15-day refund period.
Recognize the problem
Three signals that the current approach is costing clarity.
A useful financial model explains which drivers produce the result, rather than merely displaying an annual figure.
Inputs are not connected to the decision.
The example does not explain how to customize it.
Practical outcome
Build an integrated forecast of revenue, costs, expenses, personnel, investment and cash.
What is included
The working pieces, connected.
Minimum scope
Modelo de 60 meses con al menos diez tabs, fórmulas conectadas, tres escenarios y dashboard.
Safe preview
Inputs, summarized statements and sensitivity. Yellow controls are centralized on Inputs. Mode 1 uses four revenue streams and five roles; mode 2 uses the original aggregate amounts. The two modes are not added together. The written three-stream example is retained as historical material; the table contains four and each can be disabled. All data are fictional.
The preview shows structure and a limited example; it does not expose the complete paid editable or delivery file.
How it works
From context to a reviewable output.
- 1
Define the context and decision.
- 2
Complete the required inputs.
- 3
Produce a first working version.
- 4
Review, validate and adapt.
This is for
Consultants, agencies, family businesses, digital retailers, microbusinesses and independent professionals.
This is not for
It is not for anyone seeking guaranteed results, regulated advice or a file that works without data or review.
Method and limits
Useful when judgment stays in the loop.
Methodology and author
Define context, complete inputs, produce, review and adapt. Designed and signed by Julio Alonzo. Designed and signed by Julio Alonzo.
Requirements and limitations
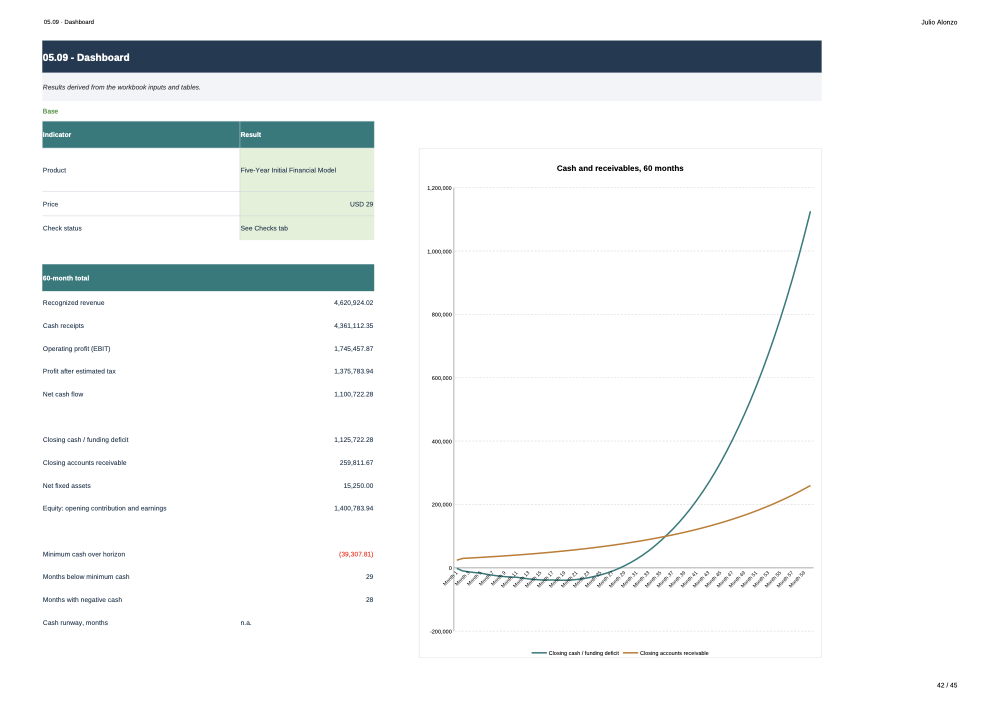
Yellow controls are centralized on Inputs. Mode 1 uses four revenue streams and five roles; mode 2 uses the original aggregate amounts. The two modes are not added together. The written three-stream example is retained as historical material; the table contains four and each can be disabled. All data are fictional. Recognized revenue = price × initial volume × (1 + monthly growth) raised to month minus one, for each enabled stream. The scenario multiplies revenue and receipts. Volume may represent services, customers or locations; cohorts and churn are not modeled. Variable costs and estimated tax are percentages of recognized revenue. Collections: whole days from 0 to 1800; monthly lag = days/30 rounded up. Zero collects in the same month; 1–30 in the next month, 31–60 two months later. There are no opening receivables or defaults. Uncollected invoices remain in receivables, including at month 60. This is not a daily calendar. Personnel: monthly salary × full-time-equivalent quantity, starting in hiring month 1–61. Month 61 is outside the horizon. Annual increases apply every twelve months from hiring. Additional payroll burden applies to both modes. Fixed expenses and marketing grow by (1 + annual inflation) raised to (month minus one)/12. Expenses, payroll, estimated tax and capex are paid in their month. Tax is an editable revenue-rate estimate, not a jurisdiction-specific tax or profit-tax calculation. Capex is not an operating expense: each purchase depreciates straight-line from the following month over the stated useful life, 1–600 months. No opening fixed assets, disposals or residual value. The planning balance reconciles signed cash, receivables and net fixed assets against independent opening equity and cumulative earnings. Debt, liabilities, inventory and VAT are not modeled. Negative cash indicates unfunded financing needs, not an automatic loan or an available bank balance. Minimum cash triggers alerts; it does not block payments. One scenario feeds the 60-month detail. The live three-case comparison uses the same shared schedules for five annual closings; it does not show each case’s worst month. Sensitivity changes the revenue multiplier and variable-cost ratio; all else stays constant. Runway: positive cash divided by average net monthly burn over the last twelve available months. No burn: n.a.; zero or negative cash: 0. Rounding tolerance: 0.000001 currency units. The native Microsoft Excel interface was not tested.
Cutoff date: 2026-10-12
FAQ
Before purchasing.
Answers derived from the product file and its commercial kit.
Secure purchase
Pay at Recurrente. Download here.
The Site never receives card data. Recurrente confirms the payment by signed webhook and this page releases only the files linked to that paid session.
$29
- ✓ One-time payment in USD
- ✓ Verified ZIP package
- ✓ 15-day refund period
- ✓ Support by email
Same system