Calculate how much you need to sell using your costs and assumptions
Break-even in units, sales and time, even with more than one product.
One-time payment
$9
Hosted checkout by Recurrente · immediate on-site fulfillment after payment confirmation · 15-day refund period.
Recognize the problem
Three signals that the current approach is costing clarity.
Selling more does not always improve the outcome when the contribution margin is too low.
Inputs are not connected to the decision.
The example does not explain how to customize it.
Practical outcome
Determine the unit volume, sales revenue or number of operating days needed before generating a profit.
What is included
The working pieces, connected.
Minimum scope
Workbook con modo simple y multiproducto, gráfico y tres escenarios.
Safe preview
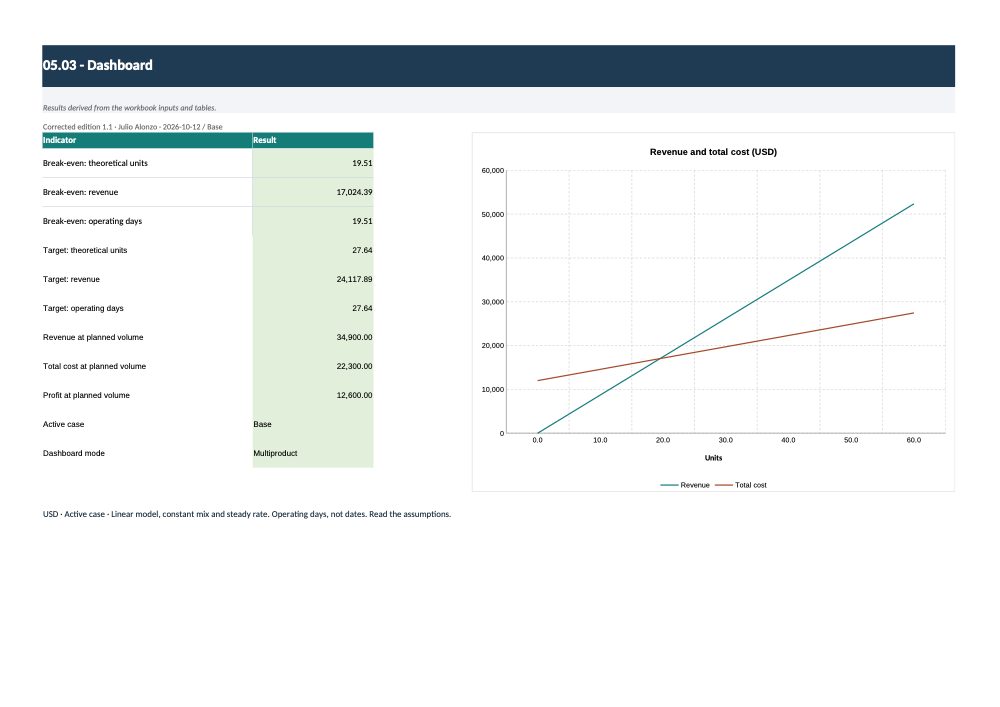
Visual results and price/cost sensitivity. Scenario 1 conservative: price ×0.90 and variable cost ×1.10; 2 base: ×1 and ×1; 3 aggressive: price ×1.10 and variable cost ×0.95. Factors are editable and purely illustrative. Fixed cost remains constant. One selection drives both models, examples and dashboard.
The preview shows structure and a limited example; it does not expose the complete paid editable or delivery file.
How it works
From context to a reviewable output.
- 1
Define the context and decision.
- 2
Complete the required inputs.
- 3
Produce a first working version.
- 4
Review, validate and adapt.
This is for
Consultants, agencies, family businesses, digital retailers, microbusinesses and independent professionals.
This is not for
It is not for anyone seeking guaranteed results, regulated advice or a file that works without data or review.
Method and limits
Useful when judgment stays in the loop.
Methodology and author
Define context, complete inputs, produce, review and adapt. Designed and signed by Julio Alonzo. Designed and signed by Julio Alonzo.
Requirements and limitations
Calculation basis: all amounts are USD and cover the same 12-month period. Fixed costs and the target are period totals; price and variable cost are per unit sold. Taxes, financing, receipts, payments, inventory and capacity are not modeled. The result is simplified operating profit, not cash flow. Contribution per unit = price − variable cost. Theoretical break-even = fixed cost / contribution. Target units = (fixed cost + profit target) / contribution. Revenue = units × price. The model assumes constant prices, unit costs and fixed costs within the range analyzed. Multiproduct mix consists of unit shares, not revenue shares, and must total 100%. Weighted price and cost use this constant mix. Aggregate units are a theoretical combination of the three lines and may be fractional. Individual lines are not rounded and a feasible whole-unit mix is not promised. Single-product mode: select one of the three lines. Whole units are rounded up and the resulting actual profit is shown. The theoretical figure is the unrounded threshold. With zero fixed costs, break-even at zero volume is zero; this does not mean selling at a negative contribution is profitable. Operating days = theoretical units / units per operating day. The rate must be positive and steady. All costs of the selected period are covered; these are not calendar dates or a receipts forecast. Planned volume is used to calculate revenue, costs and profit for that same period. Scenario 1 conservative: price ×0.90 and variable cost ×1.10; 2 base: ×1 and ×1; 3 aggressive: price ×1.10 and variable cost ×0.95. Factors are editable and purely illustrative. Fixed cost remains constant. One selection drives both models, examples and dashboard. Sensitivity: native two-variable Data Table. Columns = additional price factor, rows = additional variable-cost factor. It recalculates break-even units for the selected mode. The 1×/1× point reconciles to the active model. The table does not change fixed cost, mix or scenario. No finite solution means zero or negative contribution cannot cover a positive fixed-cost-plus-target amount. Review indicates missing or invalid data or an outstanding check. Checks are terminal and do not feed financial formulas. Review losses, assumptions and data before using results. The native Microsoft Excel interface was not tested.
Cutoff date: 2026-10-12
FAQ
Before purchasing.
Answers derived from the product file and its commercial kit.
Secure purchase
Pay at Recurrente. Download here.
The Site never receives card data. Recurrente confirms the payment by signed webhook and this page releases only the files linked to that paid session.
$9
- ✓ One-time payment in USD
- ✓ Verified ZIP package
- ✓ 15-day refund period
- ✓ Support by email
Same system