See on one screen what is generating profit and what is consuming it
Revenue, costs, expenses, margin and monthly trends compared with budget.
One-time payment
$19
Hosted checkout by Recurrente · immediate on-site fulfillment after payment confirmation · 15-day refund period.
Recognize the problem
Three signals that the current approach is costing clarity.
Higher billings can hide the fact that costs and expenses are growing even faster.
Inputs are not connected to the decision.
The example does not explain how to customize it.
Practical outcome
View revenue, costs, expenses, margin and monthly profit without building a statement from scratch.
What is included
The working pieces, connected.
Minimum scope
Workbook de al menos cinco tabs, 12 meses, dashboard y datos de ejemplo.
Safe preview
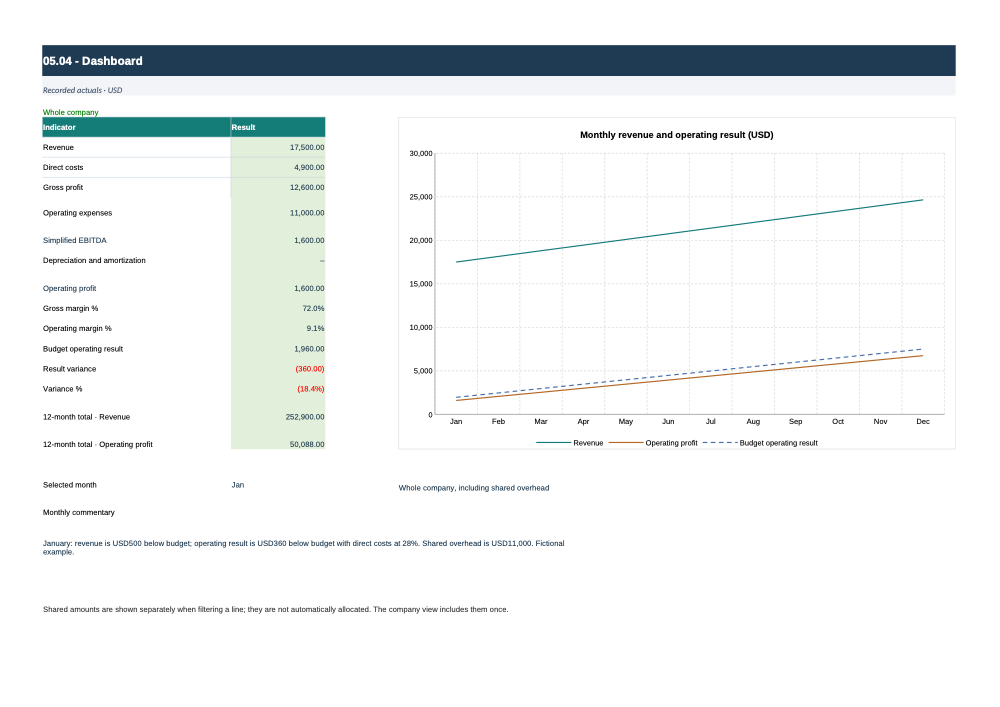
Complete dashboard with commentary for one month. The January commentary describes the whole-company example; it is editable text and does not rewrite itself. Update it when data or filters change. The selected month displays the same linked note on the dashboard.
The preview shows structure and a limited example; it does not expose the complete paid editable or delivery file.
How it works
From context to a reviewable output.
- 1
Define the context and decision.
- 2
Complete the required inputs.
- 3
Produce a first working version.
- 4
Review, validate and adapt.
This is for
Consultants, agencies, family businesses, digital retailers, microbusinesses and independent professionals.
This is not for
It is not for anyone seeking guaranteed results, regulated advice or a file that works without data or review.
Method and limits
Useful when judgment stays in the loop.
Methodology and author
Define context, complete inputs, produce, review and adapt. Designed and signed by Julio Alonzo. Designed and signed by Julio Alonzo.
Requirements and limitations
Management P&L from January to December, in USD with no currency conversion. Revenue is net of indirect taxes; positive expenses are subtracted. Documented negative adjustments are allowed. Interest, income taxes and a full accounting balance sheet are outside scope. The example is fictional. Original actual and budget revenue totals are preserved and split here 60% / 25% / 15% across three lines solely to demonstrate the filter. Illustrative direct costs are 28% of each line; monthly payroll of USD4,800 and administration of USD6,200 are shared. Software, marketing and D&A start at explicit zero. Actual entries and budget are independent of forecast assumptions. Replace monthly amounts with your own records and budgets. Changing a forecast assumption does not rewrite actuals. Original estimated costs are used only as initial fictional values. Select line 0 for the whole company or 1–3 for a business line. Line code 0 identifies shared amounts. The filtered view shows contribution before those amounts; it is not fully allocated profit. You can record expenses directly against a line when you have a documented attribution. The chart of accounts allows codes, names and type 1–4 to be changed. If you change a used code, update it in the entry tables as well. Types classify revenue, direct costs, operating expenses and D&A. They are not a mandatory jurisdiction-specific chart of accounts. Margin rates are result divided by revenue. Cumulative figures sum amounts and recalculate the rate; they do not average monthly percentages. At zero revenue, the rate is unavailable. Operating profit subtracts entered D&A; forecast capex is not subtracted from P&L. The January commentary describes the whole-company example; it is editable text and does not rewrite itself. Update it when data or filters change. The selected month displays the same linked note on the dashboard. 20 account rows and 20 account/line combinations per table. Use prepared blank rows. Zero means a known nil amount; a blank cell in a used row means missing data. Variance = actual − budget. Positive is favorable for revenue and profit. Percentage = variance / absolute budget; zero budget returns n.a. Factors change only the separate forecast. Select 1, 2 or 3 to compare recalculated results. Actuals and budget do not change. Collections and payments are assumed in the same month. Illustrative charge is a percentage of revenue, with no local tax calculation. Capex is a cash outflow; D&A is recorded separately in P&L. These reconciliations detect defined inconsistencies; they do not certify the accounts or entered data. The native Microsoft Excel interface was not tested.
Cutoff date: 2026-10-12
FAQ
Before purchasing.
Answers derived from the product file and its commercial kit.
Secure purchase
Pay at Recurrente. Download here.
The Site never receives card data. Recurrente confirms the payment by signed webhook and this page releases only the files linked to that paid session.
$19
- ✓ One-time payment in USD
- ✓ Verified ZIP package
- ✓ 15-day refund period
- ✓ Support by email
Same system